
There are two types of Halloween people: those who like jump scares and those who don’t. But even if you’re a fan of haunted hayrides and movies like The Conjuring, you probably don’t want to ever get a jump scare from your portfolio, which is why so many investors use diversified index funds with the bulk of their wealth.
When momentum fades in a stock, the bottom can drop out quicker than the Tower of Terror. However, if you’re an active trader, you must spot signs of an ominous momentum shift before it becomes a trend. And just like a scary movie, stocks often provide hints that something nefarious is lurking.
Today, we’ll examine three companies forming a dreaded technical pattern: the Death Cross.
Death Cross Insinuates a Bearish Momentum Swing
The Death Cross is one of the more recognizable bearish signals because its appearance is always prominent and easily identified. Death Crosses form when a stock’s 50-day moving average drops below its 200-day moving average, with the two lines forming an ‘X’ on the daily chart. When the 50-day dips below the 200-day, short-term momentum is weakening, and a trend shift could be on the horizon.
Even though the Death Cross uses two long-term averages, it’s used by traders with various timelines and investment goals. Technical traders see Death Crosses as a spot to take profits or enter short positions in individual stocks or ETFs.
Institutional investors with longer timeframes watch for the Death Cross on major indices as a ‘risk off’ signal, which means lowering exposure and sitting on more cash than usual. Death Crosses on the S&P 500 preceded long-term bear markets in 2000, 2007, and 2022.
Just because the Death Cross forms an X doesn’t mean it always marks the spot. It’s a lagging indicator, meaning stocks are often already declining by the time the alarm sounds. This scenario unfolded during the quick bear market of December 2018, where stocks started recovering by the time the Death Cross hit.
To minimize false alarms, you’ll want to use other metrics like the Relative Strength Index (RSI) or MACD to confirm the momentum shift.
3 Death Cross Stocks Sending Scary Signals to Investors
Finding stock charts with Death Crosses is the easy part. Once you identify the signal, you must research other fundamental and technical factors. For example, a Death Cross that precedes a blowout earnings report or takeover bid will quickly be rendered moot. Each of the three stocks listed below faces some kind of fundamental or technical headwind in addition to a Death Cross.
Boston Scientific: Elevated Valuation Leaves Little Margin For Error
Medical device manufacturer Boston Scientific Corp. (NYSE: BSX) continues to produce strong earnings beats and sales growth, but not to a level that seems to impress the market anymore.
The company beat top and bottom line estimates during its Q2 2025 report, growing sales 22% year-over-year (YOY). But the stock is down 3% over the last three months, and its 14% gain in the previous 12 months also lags major indices.
The chart highlights the market shrugging off BSX’s results, and now any remaining momentum appears to be cratering completely. The price broke through a key support level at the 50-day simple moving average (SMA), taking out the 200-day SMA on its way down.
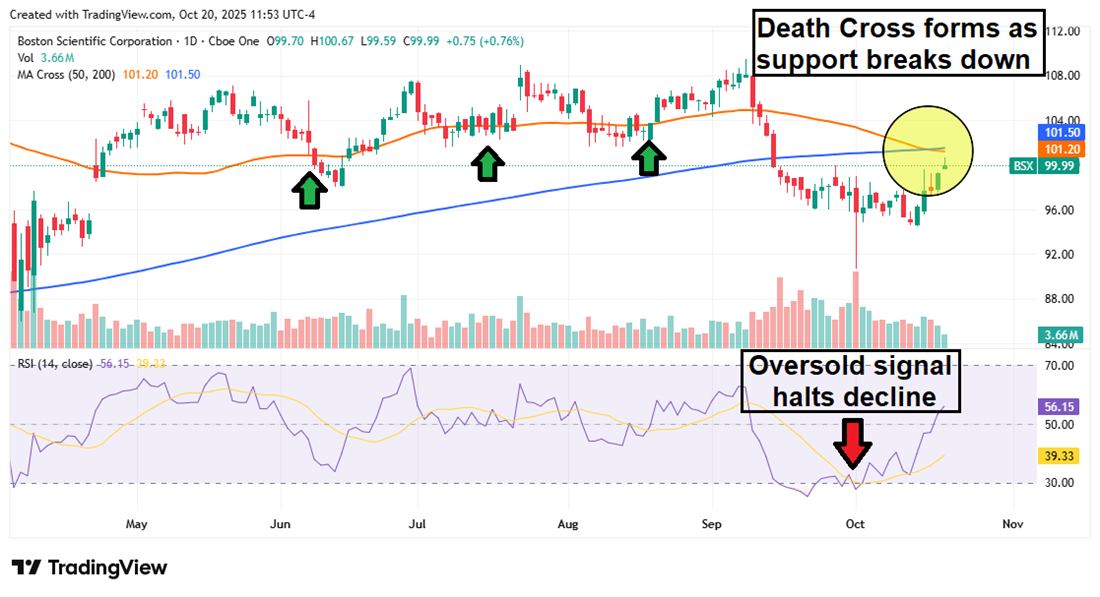
The Death Cross appeared as the stock stabilized in October, and now the previous support levels could become resistance. BSX also faces fundamental headwinds from its heightened valuation. The stock is trading at nearly 60x earnings and 10x sales, both figures well above the medical sector average.
Darden Restaurants: Momentum Fading as Costs Rise
Popular chains like Olive Garden, Longhorn Steakhouse, Yardhouse, and Bahama Breeze all fall under the umbrella of Darden Restaurants Inc. (NYSE: DRI).
While the company does have high-end restaurants like Capital Grille in its portfolio, most of its stores are full-service casual dining, a segment that has been steadily losing market share to fast casual.
And with the costs of labor and crucial inputs like beef rising rapidly, full-service casual restaurants are struggling to keep prices competitive.
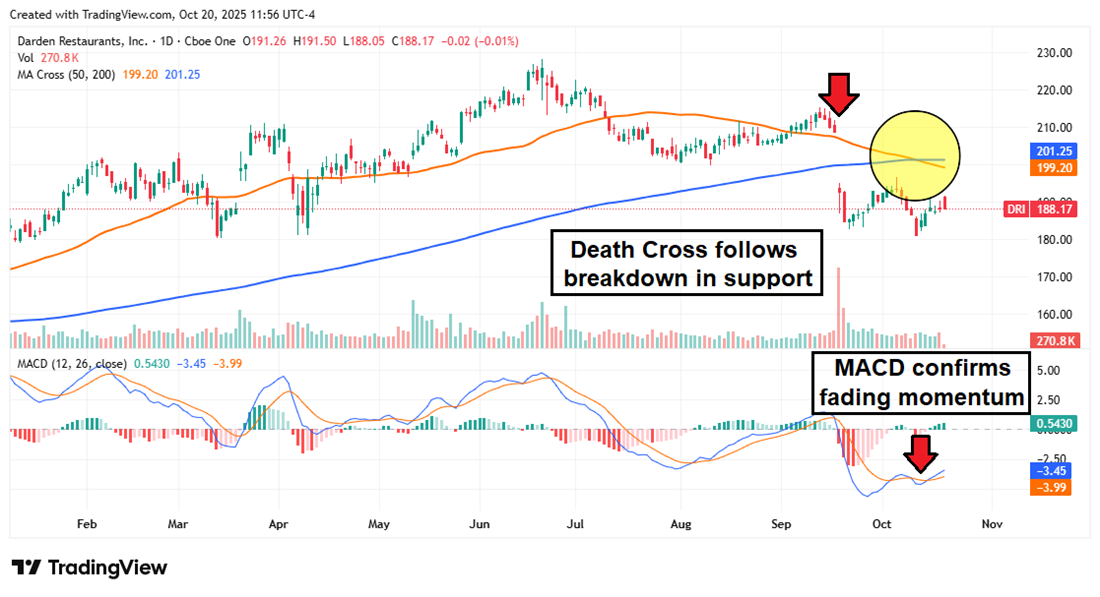 DRI shares are starting to feel the pressure. The stock recently took out the 50-day SMA support level, which had been in place since the start of the year, and all upward momentum has completely dissipated. Unless the restaurant industry rebounds, DRI is likely to continue languishing.
Stryker: Strong Financial Performance Hides Weakening Momentum
Stryker Corp. (NYSE: SYK) is another medical device company of comparable size and scope to Boston Scientific.
However, Stryker has a more modest valuation and produces consistent top and bottom line earnings beats (as it did once again in Q2 2025).
So why is its stock only up 3% in the last 12 months?
The company relies on devices and tools for elective procedures, such as joint replacements.
This segment is beholden to larger macroeconomic trends and sentiment, and Stryker’s international footprint leaves it susceptible to tariffs.
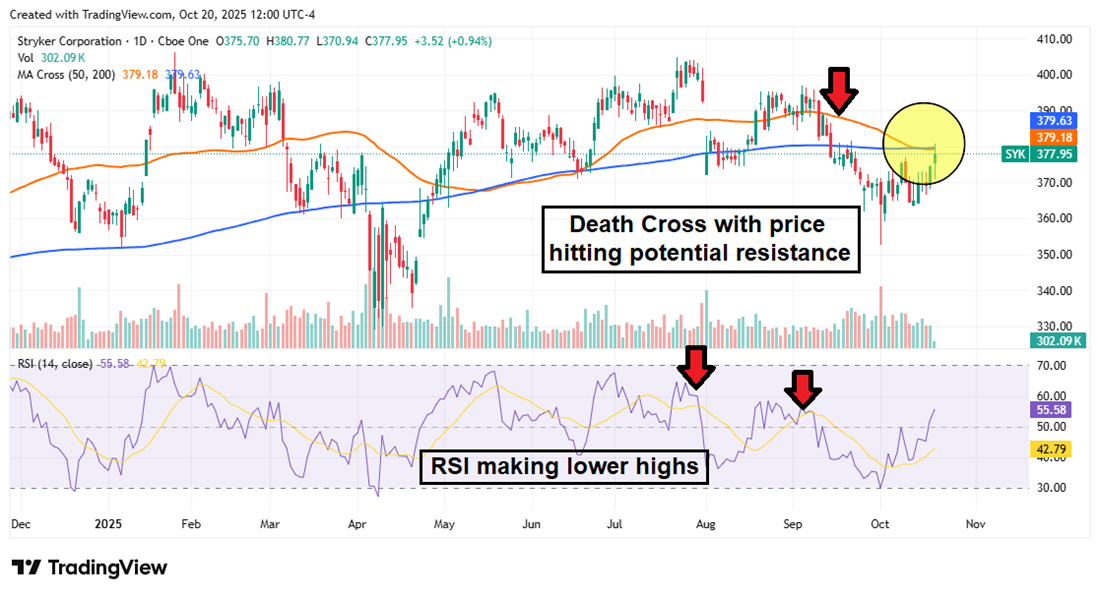
The SYK chart shows that the next few sessions will be crucial. A Death Cross is forming as the price approaches the 200-day SMA, a previous area of support, and the RSI suggests momentum is weakening. If the price is rejected at the 200-day, there’s likely more downside for SYK shares.