
Earnings season for Q3 2025 is well underway, but the exuberance from Q2 has faded. According to FactSet, more than 80% of S&P 500 companies reporting so far have beaten analysts’ expectations with their Q3 results, but the strength of those beats has been underwhelming. The average beat was just 5% above targets, significantly lower than both the five-year average of 8.4% and the 10-year average of 7%.
Of course, one quarter doesn’t equate to a trend, and talking about the strength of a 5% vs. 8% earnings beat is a bit like Goldilocks discussing porridge preferences.
Markets have been looking tired over the last two weeks, and investors are on alert for signs that trouble is brewing. One red flag: the companies that haven’t beaten Q3 earnings expectations have been getting crushed, especially those with consumer-facing businesses.
Pinterest Inc. (NYSE: PINS), Match Group Inc. (NASDAQ: MTCH), and Live Nation Entertainment Inc. (NYSE: LYV) are three companies that recently reported lackluster earnings, leaving investors wondering if it is a one-time misstep or a sign of deeper trouble.
Pinterest: Ad Weakness Outweighs AI Growth
Share of social media discovery platform Pinterest plunged nearly 22% following a rough Q3 earnings report on Nov. 4.
On the surface, this report didn’t appear to be a massive miss, but a closer examination of the numbers revealed several potential headwinds.
The company missed earnings per share (EPS) estimates by just four cents (38 cents reported vs. 42 cents expected), and revenue of $1.05 billion matched the anticipated figure. Monthly average users surpassed 600 million for the first time, and the company’s AI-bot called Pinterest Assistant increased sales conversions.
So why did the stock drop more than 20%?
Pinterest might seem like a tech stock, but it’s really more consumer discretionary, and tariffs (especially on furniture) have indirectly hurt the company’s business model. Pinterest relies on ad sales for revenue, and the company’s Q3 report noted that ad pricing declined 24% year-over-year (YOY). Pinterest’s focus on home design is negatively impacted by furniture tariffs, which have increased prices on many popular items and reduced the conversion rate from clicks to sales.
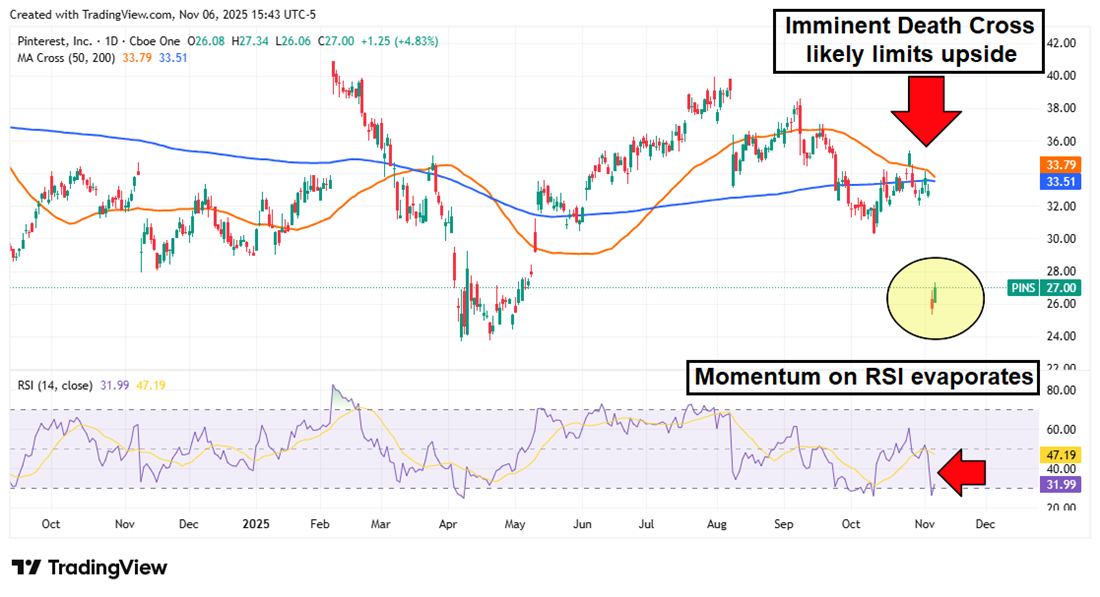
The chart paints an ugly picture as well. PINS had been stuck in range-bound trading, but now the stock is back to Liberation Day levels, and a Death Cross looks imminent on the 50- and 200-day simple moving averages (SMAs).
More than a dozen analysts lowered their price targets on PINS last week, making it difficult to recommend this stock until fundamental or technical conditions improve.
Match Group: Mixed Signals Below the Surface
Match Group is the company behind a host of popular dating apps, including Tinder, Hinge, OKCupid, and its namesake, Match.com.
The company released its Q3 2025 earnings on Nov. 4, reporting EPS of 82 cents, which missed the expected 91 cents. The total Q3 revenue figure of $914 represented just a 2% YOY increase and narrowly missed expectations.
While Hinge's growth was highlighted on the conference call, Tinder has stagnated, and paying users have declined by 5% YOY.
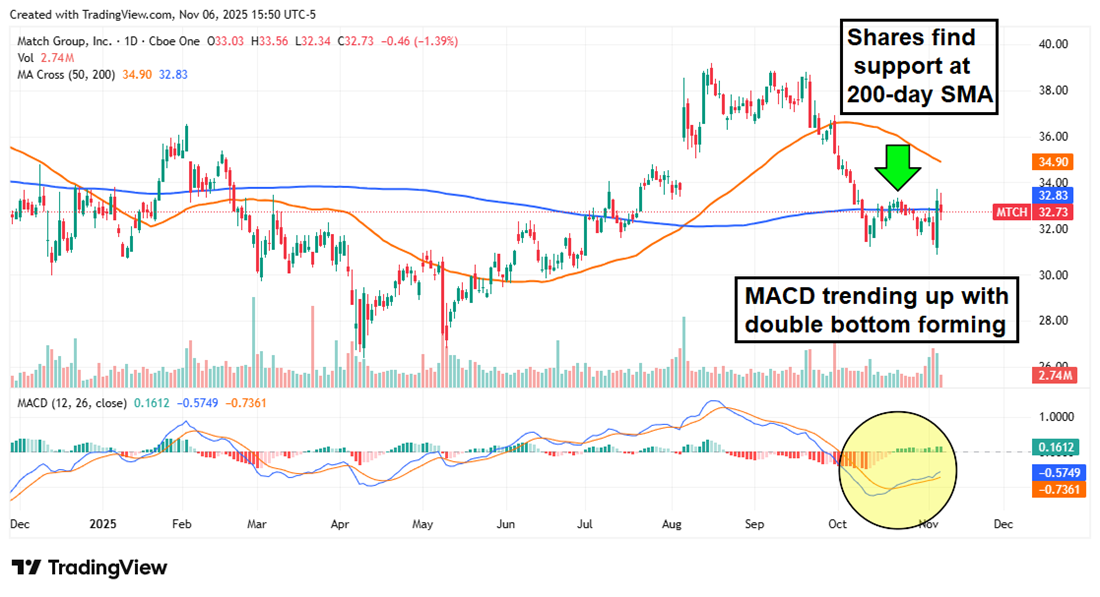
MTCH shares are down 10% over the last three months, but the chart indicates some potential upside. The decline was halted at the 200-day SMA, which appears to be strengthening as support. The MACD is also trending upward, indicating that the stock may have bottomed, at least in the short term.
Live Nation: Don’t Look Back in Anger (After Taking Profits)
Live Nation investors experienced a profitable summer, with the stock rising from $115 to $175 between March and October. But the good times are no longer rolling following a poor Q3 earnings release and a series of troubling technical patterns.
Live Nation reported a significant top-line miss on Nov. 4, with EPS of just 73 cents, significantly below the expected $1.54. Revenue also fell short of expectations by more than 4%.
Management cited several headwinds during the call, including cases against Ticketmaster from both the FTC and the DOJ, and the surge in stadium show sales is likely to be limited.
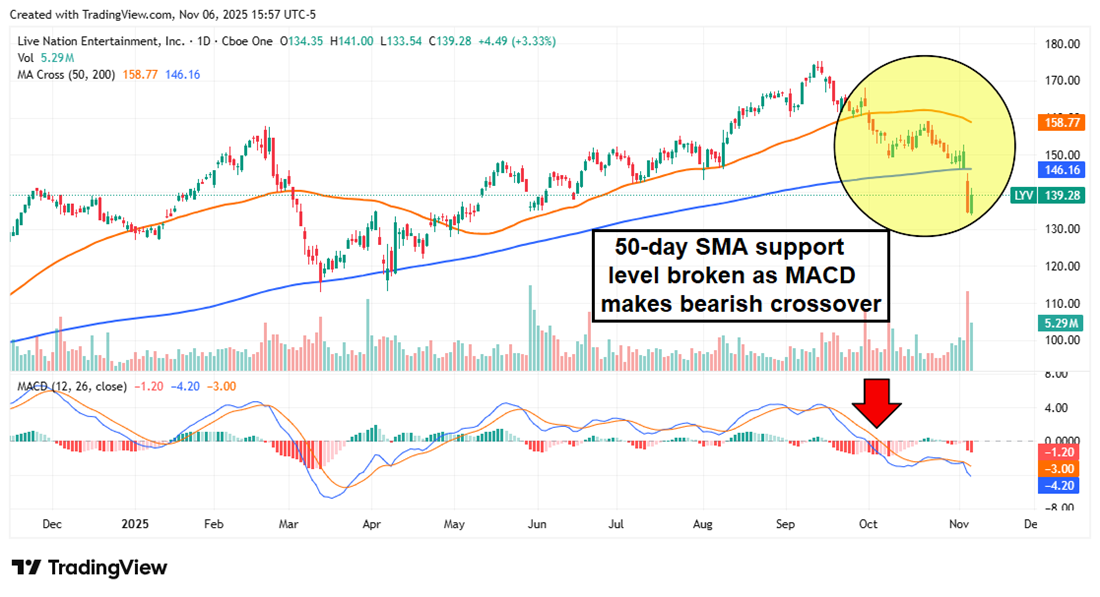 Before the earnings miss, the stock had been hinting at trouble ahead. Shares broke the 50-day SMA in September, marking a significant move as the MACD confirmed the downward shift.
Following the earnings report, the stock drifted below the 200-day SMA, hammering home the bearish trend. Live Nation might need another Taylor Swift tour to reverse this momentum.