
Investors are on edge as the S&P 500 dropped below its 50-day moving average for the first time since the tariff tantrum back in April. But if you’ve been actively trading these markets, you’ve likely noticed trouble brewing for a few weeks as speculative assets like AI stocks and Bitcoin have plummeted while gold and safer sectors soar.
The S&P 500 hasn’t suffered a broad decline since early April, and the index still has a ways to fall before entering correction territory. However, the wobble has reached the large caps and major indices, which likely means it’s time to bail (or at least lighten up) on any speculative holdings.
Today, we’ll examine a few factors that have spooked markets lately, and name three speculative stocks that appear to have exhausted their upward momentum.
Market Volatility Has Driven Investors Toward Safer Sectors
Several factors are putting pressure on major stock indices right now, but these are being felt hardest by sectors with elevated valuations and speculative potential. One troubling trend among capital-hungry sectors, such as tech, is the Federal Reserve’s hawkish turn toward a potential December rate cut.
Atlanta Fed President Raphael Bostic, St. Louis Fed President Alberto Musalem, and Cleveland Fed President Beth Hammock all echoed concerns that inflation is yet to be fully tamed, and the CME Fedwatch tool currently lists the odds of a December rate cut at 49%, down from 94% just one month ago.
If rates are going to remain higher for longer, then the capital being spent on AI will be more expensive than previously anticipated. A restrictive monetary environment will hurt companies that rely on continuous capital expenditures, especially if their profits are minimal and their stock performance is tied to sentiment rather than fundamentals.
Investors have taken notice and started rotating into safer assets like gold and healthcare stocks, sending speculative stocks down even more.
3 Speculative Stocks With Fading Momentum
If you haven’t yet sought safer waters concerning these three companies, it might be time to look for an exit. Each one is explicitly linked to a speculative asset or industry, and technical headwinds are beginning to materialize on their daily stock charts..
IREN: Valuation Dislocation
Formerly known as Iris Energy, IREN Limited (NASDAQ: IREN) is involved with two industries currently facing the wrath of the valuation gods: cryptocurrency and data centers. IREN began its business as a Bitcoin miner, but pivoted to the data center industry once capital began flowing freely into the AI gold rush. IREN’s data center business is the primary driver of the stock's nearly 400% year-to-date (YTD) gain, but it’s highly dependent on cash flow from Bitcoin mining, which requires a high Bitcoin price to remain profitable.
Unfortunately, Bitcoin hasn’t been cooperating; the BTC spot price dipped below $90,000 this week for the first time since April, and that’s bad news for a company that trades at more than 27x sales.
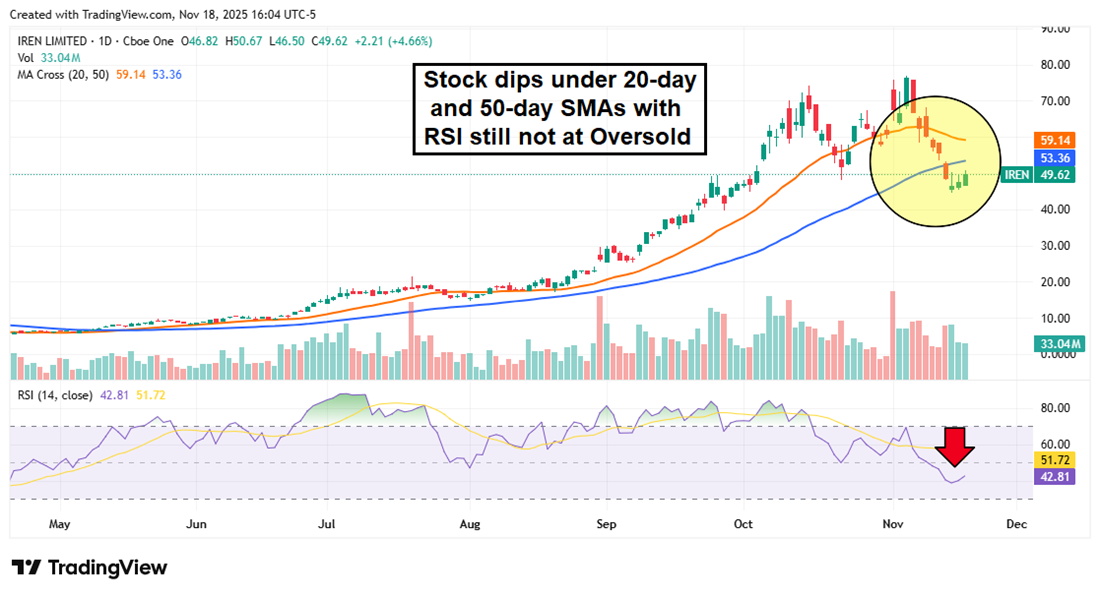
IREN shares are facing a double whammy: a shift away from high-beta tech and the decline in cryptocurrency markets. The chart is starting to show evidence of these cracks, with the short-term trend looking to be breaking down.
The stock now trades below its 20-day and 50-day simple moving averages (SMAs), and the Relative Strength Index (RSI) is at its lowest point since May.
Cipher Mining: Bitcoin Blowout Driving Shares Lower
Bitcoin miners were already facing a profitability headwind from the 2024 halving, which cut mining rewards in half from 6.25 BTC to 3.125 BTC.
Cipher Mining Inc. (NASDAQ: CIFR) shook off this headwind with a more than 200% stock gain over the last calendar year, including a 140% gain in the previous three months alone.
But much of the computer equipment needed for high-efficiency mining is also required for AI data centers, putting Bitcoin miners up against some very deep-pocketed adversaries.
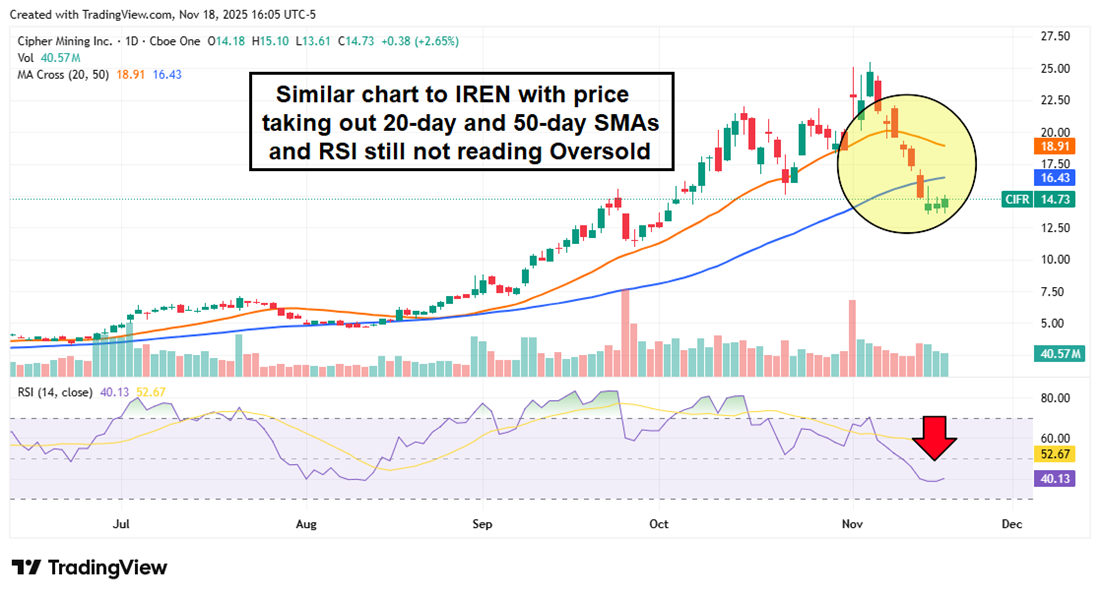
Cipher Mining reported record revenue in its Q3 2025 earnings release but remains unprofitable, and management expects more supply chain delays into 2027. And much like IREN, the chart is showing downward price pressure, with the 20-day SMA dipping below the 50-day SMA and the RSI trending lower (but far from Oversold territory).
Array Technologies: Solar Rally Losing Steam
Solar was one of the more surprising sectors to rally following the passage of the Republican-led One Big Beautiful Bill Act (OBBBA), considering how hostile the legislation was to solar and wind energy. Solar subsidies were phased out for both commercial and residential projects, but that didn’t stop the Invesco Solar ETF (NYSEARCA: TAN) from doubling between April and November.
Array Technologies Inc. (NASDAQ: ARRY) was a beneficiary of this solar rally, soaring more than 140% in just six months. Array develops solar trackers, which allow panels to rotate into the path of sunlight throughout the day.
Array must hurdle several headwinds to keep this rally going, including the loss of federal subsidies, a 110-basis-point margin hit from tariffs, high short interest (28% of the float), and cratering cash flow.
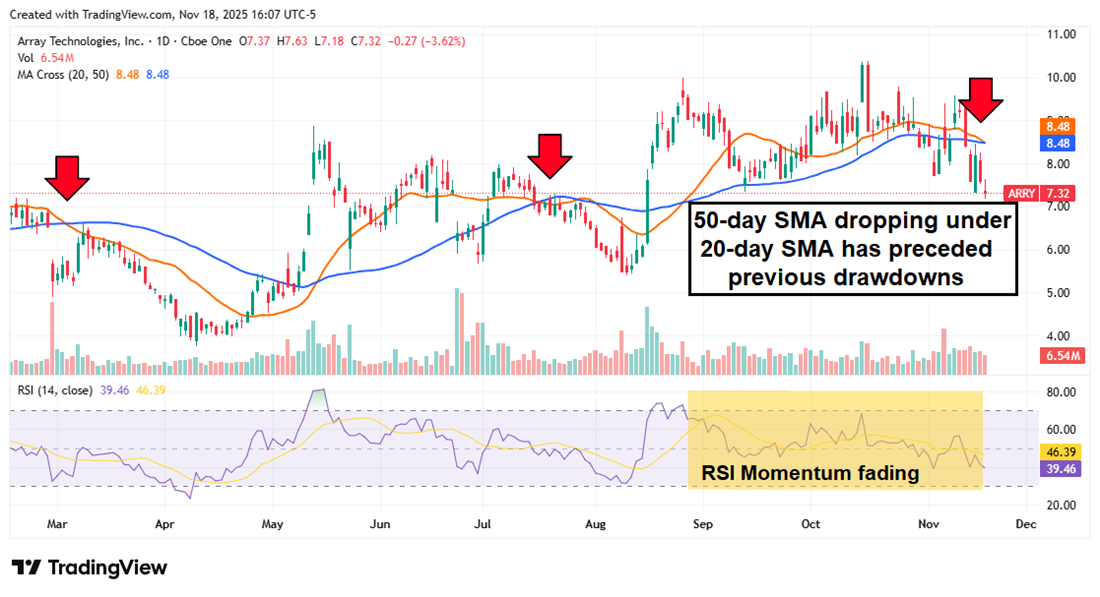
Despite its accelerating share price, ARRY has been losing momentum since late August. Each time the 20-day SMA dipped under the 50-day SMA, it triggered a short-term decline that rebounded shortly thereafter. But the RSI has been trending downward for weeks, and the two SMAs are once again about to cross, which could trigger the most substantial wave of bearish momentum yet.