Earnings season is off to a rough start. That “Oooof” sound you hear is investors sighing as they see their last three months of gains in bank stocks evaporate after the bank reports its earnings.
It started with JPMorgan Chase & Co. (NYSE: JPM). The bank, widely considered to be the best in breed, has seen its stock drop over 5% after reporting a double beat that included optimistic remarks from Jamie Dimon about the health of the consumer.
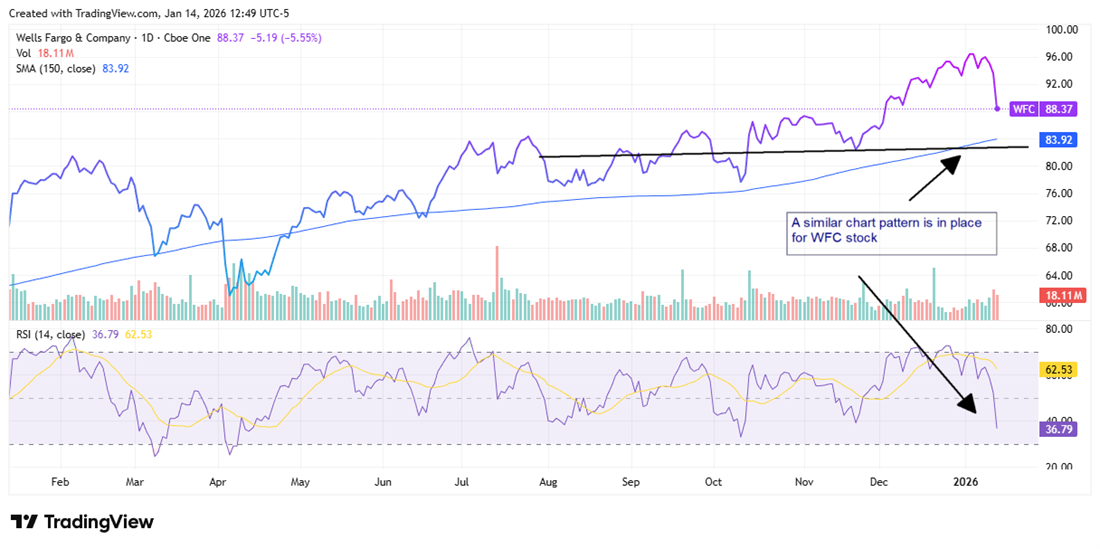
That trend continued after the reports by Bank of America (NYSE: BAC) and Wells Fargo & Co. (NYSE: WFC). The stocks are down 4.9% and 5.5% respectively, in midday trading after each bank reported earnings on Jan. 14.
Bank of America delivered what was widely seen as a solid report with topline and bottom-line beats. Wells Fargo, by contrast, delivered a mixed report that included revenue falling short of analysts’ expectations.
Valuation Could Be the Canary in the Coal Mine
A common denominator between these three “big banks,” and you can include Citigroup Inc. (NYSE: C), which is also down over 4.5% after earnings, is a lofty valuation. Each bank trades at a price-to-earnings (P/E) ratio above the historical average of each stock. Quantitative analysis of metrics like their price-to-book (P/B) ratios also put the banks above the industry median.
The takeaway is simple. These stocks were priced for perfection. However, that perfection was based on the rules of the game staying the same. A recent headline called that into question.
The Headline Supporting a Strong Sell-Off
Heading into 2026, bank earnings were expected to kick off a strong earnings season. However, news that the Trump administration wants to cap credit card interest rates at 10% is an overhang that banks like Bank of America and Wells Fargo acknowledge could be detrimental to their business.
But the greater victim would be the consumers whom the Trump administration is ostensibly trying to help. Those consumers may get a lower interest rate. But the tradeoff would be less access to credit.
The key takeaway here is that the “proposal” is unlikely to happen. Analysts are skeptical that the administration could pass the mandate by executive order. And it would seem that such a proposal would be dead on arrival with a Congress that is weighing legitimate concerns about affordability with the potential impact on economic growth.
Strong Results Suggest BAC’s Pullback Was Sentiment-Driven
Bank of America’s quarter was solid across the board, which makes the post‑earnings pullback look more about sentiment and valuation than fundamentals.
Net income rose to 7.6 billion with EPS up 18% year-over-year (YOY), supported by 7% revenue growth, 10% net interest income growth, and positive operating leverage as the efficiency ratio improved to 61.
Balance‑sheet quality held up, with average loans up 8%, deposits up 3%, a CET1 ratio of 11.4, and a net charge‑off rate of just 0.44%. Management also guided to 5%‑7% net interest income growth in 2026, suggesting that earnings power should continue to compound even in a lower‑rate backdrop.
A Mixed Quarter Highlights Wells Fargo’s Transition Phase
Wells Fargo’s results were more nuanced, but not weak. Revenue grew 4% YOY, with net interest income and noninterest income each up 4%‑5%, and pre‑tax pre‑provision profit up 17%, signaling improving core profitability.
However, the efficiency ratio remains higher at 64, and the bottom line included $612 million in severance, highlighting that Wells Fargo is still in the middle innings of its restructuring and cost‑takeout story.
Credit quality is acceptable but trending later in the cycle: net loan charge-offs were 0.43% of average loans, and the allowance for credit losses stands at 1.45% of loans, with elevated reserves tied to commercial real estate office exposures.
Bank of America or Wells Fargo—Which Dip Is Worth Buying?
The better question may be, is either bank stock worth looking at after earnings? Both stock charts look remarkably similar. Both remain in bullish uptrends, provided the stock price stays above the 150-day simple moving average. And in both cases, that looks likely with the Relative Strength Indicator (RSI) indicating that selling may be overdone.
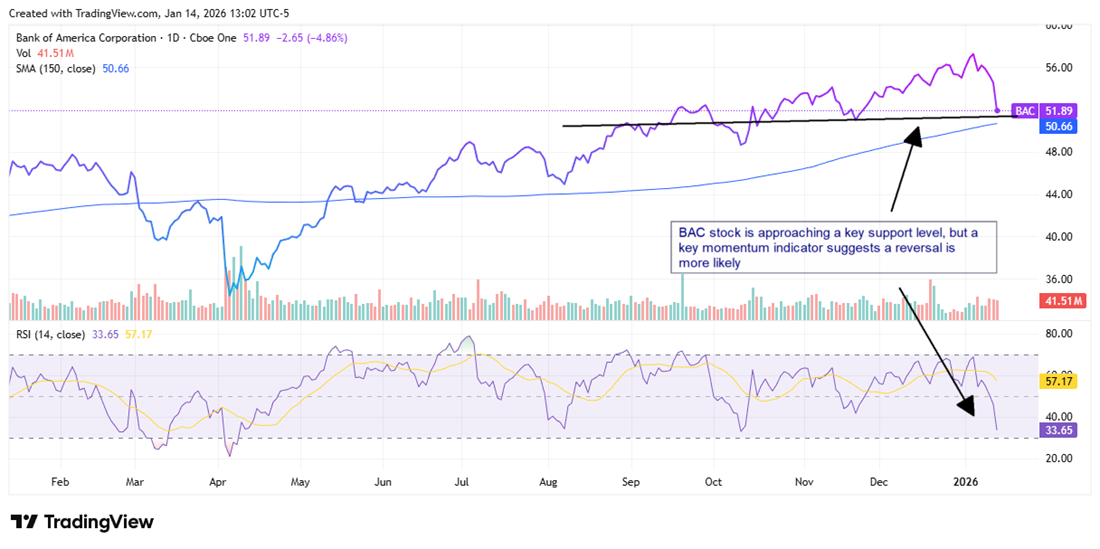
That said, BAC stock appears to be the higher-quality buy-the-dip candidate after earnings, due to diversified earnings growth and reduced credit tail risk. However, WFC stock still offers leverage to a benign credit and rate environment for investors willing to accept more volatility.