
Costco Wholesale Club Inc. (NASDAQ: COST) recently reported its June sales numbers, and on first glance, it appears to be another strong month of growth for the country’s premier wholesale club.
However, the stock’s milquetoast reaction shows how much of a curve the company is graded upon.
When your multiple looks more like a tech sector growth darling than a big box retailer, ‘good’ simply isn’t good enough.
And when you dig under the surface, the latest sales numbers highlight an unnerving trend.
Strong Headline Numbers Obfuscate Underlying Weakness
Costco released its comp sales figures for June, and it's a print that many other retailers would view with envy. Net sales for the period totaled $29.24 billion, up 10.6% year-over-year (YOY) and 7.6% when removing gas and currency effects. The board also declared a $1.47-per-share dividend, payable in August with a record date of July 24. But despite these strong headline numbers, weakness is brewing under the surface.
Gas price volatility was a major tailwind for Costco as weary consumers turned to wholesale clubs for relief at the pump. Costco typically prices its gas below retail to drive volume and get more people into its stores (also known as a loss leader). But now that gas prices are dropping again, this tailwind is evaporating, and the June sales print tells the tale. When stripping out gas and currency, the 7.6% U.S. comp number is a stark deceleration from May’s 8.7% comps ex-gas and currency. The total drop is actually even steeper; 8.8% in June versus 12.5% in May, highlighting just how much fuel prices drove the advance.
U.S. stores might be in good shape, but the international market is a growing concern. Canadian adjusted comps plummeted again from 7.6% in April to 5.6% in May to 4.9% in June, and total international adjusted comps dropped from 8.0% in May to 7.0% in June. Soft international markets could limit upside if U.S. comp sales reaccelerate, now that fighting has resumed in Iran and gas prices are once again on the upswing.
Stock Still Trades at Extreme Valuation Compared to Other Retailers
Costco remains an excellent business with a loyal membership base, strong overall sales growth (net sales up 11.6% YOY as of May’s fiscal Q3 2026 report), and a hot dog-and-soda combo that still costs just $1.50. But the stock has long been priced to imply perfect execution, and when you trade at 46 times forward earnings with a Price/Earnings Growth (PEG) ratio nearly at 4.5, investors take notice of any little dent in the armor.
The retail sector trades at about 21 times earnings, which is less than half the current valuation bestowed on COST shares. While a company with sales and membership numbers like Costco's deserves an elevated multiple, trading at more than twice the industry average while overall comp sales are declining is a blazing red flag that even a FIFA referee could see.
Prominent retailers like Walmart Inc. (NASDAQ: WMT) and Target Inc. (NYSE: TGT) trade at 40 and 18 times earnings, respectively, well below Costco’s valuation. Even a direct competitor like BJ’s Wholesale Club Holdings Inc. (NYSE: BJ) trades at 21 times earnings and 0.55 times sales.
Here’s a way to frame the new narrative shaping retail: the market is no longer looking for premium compounders like COST (up nearly 9% year-to-date), but cheap laggards like TGT, which is up more than 40% so far in 2026.
Technical Collapse Brings Shares Down With It
Costco’s fundamentals remain strong despite the sales hit, but the troublesome technicals are appearing in full force. The stock briefly surged to a new all-time high in May following gasoline shocks induced by the Iran war, as new members flocked to stores after filling their tanks with cheap fuel. But once war hostilities faded, so did the rally in COST shares. The stock has pulled back approximately 15% from its previous all-time high, and the technical signals under the hood aren’t pointing to a rebound anytime soon.
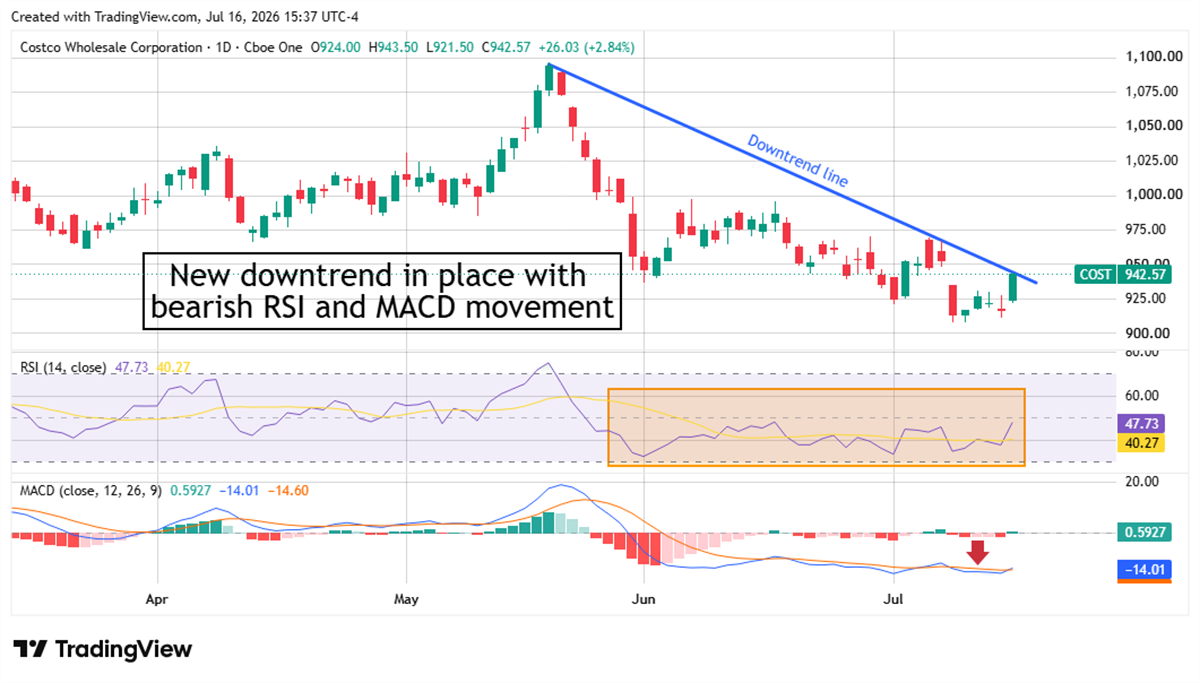
Shares now trade below the 50-day and 200-day moving averages, and the Relative Strength Index (RSI) has been firmly in bearish territory since the end of May. The Moving Average Convergence Divergence (MACD) indicator also shows downward momentum continuing to gain strength.
For long-term investors, this is likely not the time to sell, as the company still has 92% renewal rates and the digitally enabled comps are a bright spot at 21%. But new investors are likely better served waiting for a more attractive entry point. A deceleration doesn’t mean deterioration, but a stock trading at 46 times earnings can’t afford even a brief slowdown if it wants to maintain bullish momentum.