
Stock of the Day

August 17, 2026

Applied Materials (AMAT)

$370.50
-$10.45 (-2.7%)
Market Cap: $294.03B

About Applied Materials

Applied Materials, Inc. engages in the provision of manufacturing equipment, services, and software to the semiconductor, display, and related industries. The company operates through three segments: Semiconductor Systems, Applied Global Services, and Display and Adjacent Markets. The Semiconductor Systems segment develops, manufactures, and sells various manufacturing equipment that is used to fabricate semiconductor chips or integrated circuits. This segment also offers various technologies, including epitaxy, ion implantation, oxidation/nitridation, rapid thermal processing, physical vapor deposition, chemical vapor deposition, chemical mechanical planarization, electrochemical deposition, atomic layer deposition, etching, and selective deposition and removal, as well as metrology and inspection tools. The Applied Global Services segment provides integrated solutions to optimize equipment and fab performance and productivity comprising spares, upgrades, services, remanufactured earlier generation equipment, and factory automation software for semiconductor, display, and other products. The Display and Adjacent Markets segment offers products for manufacturing liquid crystal displays; organic light-emitting diodes; and other display technologies for TVs, monitors, laptops, personal computers, electronic tablets, smart phones, and other consumer-oriented devices. It operates in the United States, China, Korea, Taiwan, Japan, Southeast Asia, and Europe. The company was incorporated in 1967 and is headquartered in Santa Clara, California.

Applied Materials Bull Case

Here are some ways that investors could benefit from investing in Applied Materials, Inc.:

  • Applied Materials, Inc. reported record fiscal fourth-quarter revenue of $10.4 billion, a 53% increase year over year, driven by strong demand for equipment used to manufacture advanced chips and memory, with non-GAAP earnings per share rising 92% to $4.16.
  • The company expects wafer fab equipment demand to rise more than 30% in 2027, with management projecting that Semiconductor Systems revenue will grow more than 40% in calendar 2026, supported by investments in leading-edge logic, DRAM, and advanced packaging for artificial intelligence applications.
  • Applied Materials, Inc. provided first-quarter fiscal 2027 guidance for revenue of $11.1 billion and non-GAAP earnings per share of $4.35, representing year-over-year increases of 58% and 83% respectively, indicating continued strong growth momentum.
  • Investors can benefit from the company's strategic investment to double systems output from fourth-quarter 2026 levels by 2028 and more than double manufacturing and lab capacity by 2030, positioning it to meet rising demand for semiconductor manufacturing equipment.
  • Applied Materials, Inc. currently trades at $380.95, which is below the consensus price target of $625.76 from 30 analysts with a Buy rating, suggesting potential upside for investors who believe in the company's long-term growth prospects.

Applied Materials Bear Case

Investors should be bearish about investing in Applied Materials, Inc. for these reasons:

  • Applied Materials, Inc. shares fell 3.6% to $380.95 on November 12, 2026, despite beating earnings estimates, reflecting market concerns about the broader chip-equipment selloff and Nvidia-related tech pressure that have weighed on sentiment.
  • The stock is trading at $380.95, which is significantly below its 52-week high of $739.67, indicating a substantial decline from peak valuations and potential continued downward pressure from market volatility.
  • Applied Materials, Inc. faces supply constraints on clean room availability and equipment components as the industry expands, which could limit the company's ability to fully capitalize on demand growth and may impact its first-quarter forecast.
  • China shipments are expected to account for less than 25% of Applied Materials, Inc.'s business in 2027, even as sales there grow, reflecting geopolitical risks and potential limitations on the company's ability to expand in this important market.
  • Applied Materials, Inc. has a beta of 1.67, indicating higher volatility than the overall market, which could result in larger price swings and increased risk for investors during periods of market uncertainty.

Applied Materials Beat Everything but Wall Street’s Expectations for Margins

Written By Dan Schmidt on 8/15/2026

Applied Materials logo displayed above an illuminated semiconductor wafer on a lit display stand.

Shares of Applied Materials Inc. (NASDAQ: AMAT) sold off after its Q3 earnings report, despite the largest quarter-over-quarter revenue gain in company history. In fact, the company shredded analysts’ top- and bottom-line estimates, announced guidance above consensus, and stepped up nearly every major 2026 outlook. And then the stock dropped 6% after hours. Why the drop into such a large beat? Expectations are high for a company like Applied Materials, even after a 10% pullback in the last few weeks. Any potential red flag is immediately noticeable, and in this case, it's the gross margin line that stands out like an NFL lineman at the grocery store checkout.

Applied Materials Exceeds Consensus Targets, But Sequential Growth Slows

Back in May, Applied Materials made an audacious guidance call during its fiscal Q2 2026 report. After reporting record quarterly revenue of $7.91 billion, earnings per share (EPS) of $2.86, and a 25-year high in gross margins at 50%, management raised Q3 revenue guidance to $8.95 billion. It also projected more than 30% year-over-year (YOY) growth in its semiconductor equipment business in calendar year 2026. How did these bold projections come to pass?

The company's fiscal Q3 2026 report was released post-market on Aug. 13, and Applied Materials surpassed analysts’ consensus (plus its own projections) with $9.12 billion in revenue. The non-GAAP $3.50 EPS figure also surpassed analysts’ estimates of $3.40, and represented year-over-year (YOY) growth of nearly 30%. Semiconductor Systems accounted for $7.0 billion of the $9.12 billion in revenue, up 27% YOY with a 55.4% gross margin. Management’s Q4 revenue guidance estimates ranged from $9.75 billion to $10.75 billion, with an EPS range of $3.82 to $4.22. It also projects Semiconductor Systems to exceed its previous “greater than 30%” forecast in fiscal 2026, with $7.9 billion in projected Q4 revenue, and continued growth into fiscal 2027.

The midpoint of both ranges came in above market consensus, but these projected sequential growth rates are “just” 11% and 12%, respectively, lower than the results achieved in the most current quarter. Getting dinged for double-digit revenue and EPS projections at the midpoint is a rare sight, but expectations are sky high for a pricey tech stock up more than 100% year-to-date (YTD) and currently trading at 50 times earnings and nearly 15 times sales. Ignore the data showing these numbers growing 51% and 85% YOY; the company faced heavy export restrictions in Q4 2025 that depressed quarterly figures.

Gross Margin Projected to Stall With Operating Margin Picking Up the Slack

Management guided non-GAAP gross margins to 50.4% in Q4 2026, up more than 200 basis points YTD but sequentially flat. Operating expenses are expected to grow to $1.58 billion in Q4 as the company staffs up to meet its goal of doubling quarterly system output by 2028. The company announced six new products in the quarter and also opened its new $500 million Singapore campus.

Projected revenue of $10.25 billion (midpoint) in Q4 on gross margins of 50.4% comes to approximately $5.17 billion in gross profit. Subtract $1.58 billion in operating expenses, and the implied operating margin for Q4 comes in at 35%, which is 100 basis points higher than Q3’s operating margin of 34%. Operating margin is expected to carry the water in Q4 while gross margin stalls, and that’s a much different expansion story than the one that powered the stock to a 180% gain over the last 12 months. The market viewed operating-leverage growth as a weaker driver, adding to the stock’s sell-off.

Bearish Signals Emerge on Chart Post-Earnings

The earnings call reaction drove the stock down only slightly, but it did trigger some worrisome signals on the daily chart. A bearish Death Cross had already formed in July as the stock fell more than 10% from its June all-time high. An attempted rebound was stalled by resistance at the 200-day moving average, which held firm until the Q3 2026 numbers were released. Now the stock has taken out the 50-day moving average in the post-earnings drop, which has also driven the Relative Strength Index (RSI) below the bullish threshold of 50.
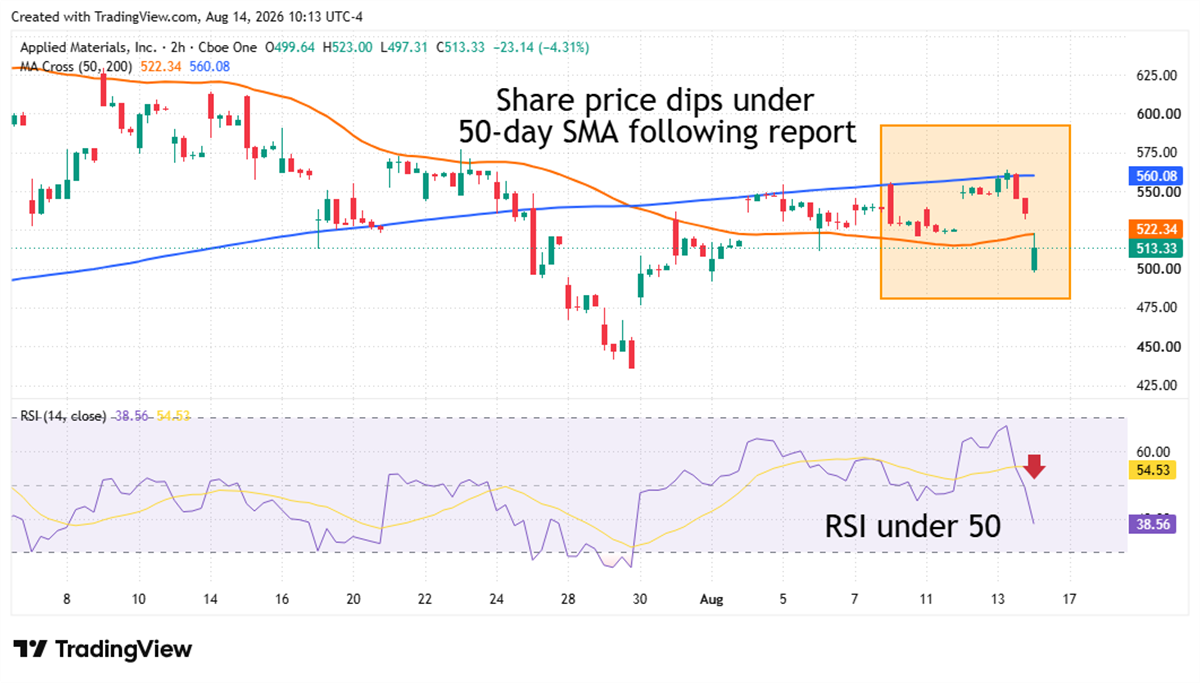
Applied Materials stock chart showing price falling below the 50-day moving average with RSI dropping under 50.

Applied Materials’ gross margin pause may be temporary as the company gears up for the next wave of AI expansion. It certainly isn’t acting like a company that foresees a slowdown, with a backlog stretching out eight quarters and 10 new fab projects announced in Q3 alone. The company’s record performance is likely to continue through 2026, but the market may keep waiting for that margin inflection point before sending AMAT shares on another parabolic run.

Recent News