
Stock of the Day

February 17, 2026

Rockwell Automation (ROK)

$422.32
-$1.10 (-0.3%)
Market Cap: $47.02B

About Rockwell Automation

Rockwell Automation, Inc. provides industrial automation and digital transformation solutions in North America, Europe, the Middle East, Africa, the Asia Pacific, and Latin America. The company operates through three segments, Intelligent Devices, Software & Control, and Lifecycle Services. Its solutions include hardware and software products and services. The Intelligent Devices segment offers drives, motion, safety, sensing, industrial components, and configured-to-order products. The Software & Control segment provides control and visualization software and hardware, information software, and network and security infrastructure solutions. The Lifecycle Services segment provides consulting, professional services and solutions, and connected and maintenance services. The company sells its solutions primarily through independent distributors in relation with its direct sales force. It serves discrete end markets, including automotive, semiconductor, and warehousing and logistics, as well as general industries comprising printing and publishing, marine, glass, fiber and textiles, airports, and aerospace; hybrid end markets, such as food and beverage, life sciences, household and personal care, and tire, as well as eco industrial, including water/wastewater, waste management, mass transit, and renewable energy; and process end markets comprising oil and gas, mining, metals, chemicals, pulp and paper, and others. Rockwell Automation, Inc. was founded in 1903 and is headquartered in Milwaukee, Wisconsin.

Rockwell Automation Bull Case

Here are some ways that investors could benefit from investing in Rockwell Automation, Inc.:

  • Rockwell Automation, Inc. recently demonstrated strong earnings momentum by beating consensus estimates in its most recent quarter, reporting earnings per share of $3.49 against an expected $3.38, while also exceeding revenue forecasts with $2.31 billion in sales compared to the $2.24 billion consensus, signaling robust demand for its industrial automation solutions.
  • The company is expanding its presence in the high-growth life sciences sector, evidenced by a recent win for a cell-therapy platform and the launch of the Digital CMC Consortium, a collaboration aimed at accelerating pharmaceutical development, which positions the firm to capture new revenue streams in biopharmaceutical automation.
  • Analysts have recently raised their earnings forecasts for Rockwell Automation, Inc., with Zacks Research increasing its full-year 2027 earnings per share estimate to $14.44 and full-year 2028 to $16.84, reflecting improved confidence in the company's ability to sustain earnings growth over the next two years.
  • Rockwell Automation, Inc. is trading at a current stock price of $433.71, which is below the average analyst target price of $469.82, suggesting potential upside of approximately 8% as the market digests recent positive developments in the industrial automation sector.
  • The company is broadening its cybersecurity offerings by expanding its SecureOT managed-services portfolio to support Fortinet firewalls and existing customer infrastructure, which may reduce adoption barriers for manufacturers and create new recurring revenue opportunities in industrial cybersecurity.

Rockwell Automation Bear Case

Investors should be bearish about investing in Rockwell Automation, Inc. for these reasons:

  • Despite recent earnings beats, the consensus rating for Rockwell Automation, Inc. remains a "Hold" with nine analysts issuing Buy ratings and thirteen issuing Hold ratings, indicating that the market views the stock as fairly valued rather than offering significant upside potential at current levels.
  • Rockwell Automation, Inc. carries a high beta of 1.51, meaning its stock price is significantly more volatile than the overall market, which could lead to larger price swings and higher risk for investors during periods of market uncertainty or economic downturns.
  • The company's valuation is relatively expensive, with a P/E ratio of 40.65, which is high compared to many industrial peers, suggesting that investors are paying a premium for growth that may not be fully justified if earnings growth slows or if macroeconomic conditions weaken industrial spending.
  • Recent insider activity has been predominantly negative, with multiple executives and directors, including CFO Christian Rothe and Director Patricia Watson, selling shares in the past few months, which may signal a lack of confidence in the stock's near-term performance or a desire to diversify personal holdings.
  • Rockwell Automation, Inc. has a debt-to-equity ratio of 0.74 and a quick ratio of 0.74, indicating that the company carries a moderate level of debt and has limited liquid assets to cover short-term liabilities, which could constrain financial flexibility if interest rates remain elevated or if cash flow generation slows.

Rockwell Automation Stock Dips After Earnings Beat: Why Bulls See a Fast Rebound

Written By Thomas Hughes on 2/7/2026

Rockwell Automation autonomous mobile robot operates beside conveyor, highlighting industrial automation driving efficiency.

Rockwell Automation’s (NYSE: ROK) February price pullback is an opportunity to invest, as it is a countertrend move within an otherwise bullish market.

This market is driven by growth, outperformance, and cash flow, which, in turn, support healthy capital returns and investor leverage. While impediments to cash flow emerged in the fiscal Q1 2026 earnings report, the impact is minimal in the grand scheme, expected, and one-off in nature. Attributed to compensation payments not logged in the prior year’s Q1, the long-term outlook remains unchanged, and the outlook for automated manufacturing is bullish. 

Rockwell Automation is critical to the application of physical AI. Its robotics and software platforms automate manufacturing workflows, increasing efficiency and quality, and are in demand globally. Analysts forecast steady, mid-single-digit revenue growth for the next five to ten years, compounded by operational improvements and widening margins. Earnings are forecast to grow at a higher mid-teens CAGR well into the next decade, likely underestimating the company’s potential. 

Rockwell Declines After Strong Quarter

Rockwell had a solid Q1, with results that outperformed estimates on the top and bottom lines. The $2.11 billion in net revenue grew 12.2% year-over-year (YOY), outperforming MarketBeat’s reported consensus by 145 basis points on strength in organic business, products and software.

The Intelligent Devices segment grew by 18%, led by a 19% increase in Software & Control, offset by a slim decline in Lifecycle Services. Organically, business grew by 10% while FX translation added 100 basis points. Annual recurring revenue, an indicator of visible, reliable revenue streams, grew by 7%.

Margin news is even better. The company’s volume leverage, pricing actions, and mix shift widened margin by 490 basis points on a pre-tax basis and 360 basis points at the segment operating level. Net income grew by a leveraged 65% and adjusted earnings per share (EPS) by 49%, outpacing consensus by nearly 1100 basis points. 

Guidance is also good, but a factor is weighing on near-term sentiment. While Q1 results showed strength, full-year guidance was reaffirmed only at prior levels. However, even at prior levels, growth and margin strength are expected to persist. The guide includes $11.80 in adjusted earnings at the midpoint, up more than 10% YOY and growing at nearly the revenue pace.

The likely outcome is that guidance is cautious, and performance will be stronger, but the market wasn’t pleased and pulled back on the news. 

Analyst Response Aligns With Trend: Higher Prices Indicated 

The initial analyst response aligns with the bullish trend, with several price targets reaffirmed within hours of the report.

The increases put the market above consensus, at a fresh all-time high at the high end, with analysts citing business trends, margin strength, and capacity for capital returns.

Capital returns are a critical factor in this thesis, including dividends and share buybacks. The dividend is worth approximately 1.3% following the February stock price pullback and is reliable at 50% of earnings, while buybacks reduce the count each quarter.

Trailing 12-month activity reduced the count by an average of 0.5% for Q1 and is expected to continue at a similar pace for the remainder of the year.

Rockwell’s price action reflects the support of analysts and institutions despite the pullback. The price discount triggered buying, leading the market to rebound from early lows and show support with a doji candle. The Hammer Doji marks the bottom of price pullbacks and indicates a high potential for a quick rebound, given its long lower shadow. The long lower shadow reveals the depth of the bearish push and the strength of the bullish response relative to the critical support target.  
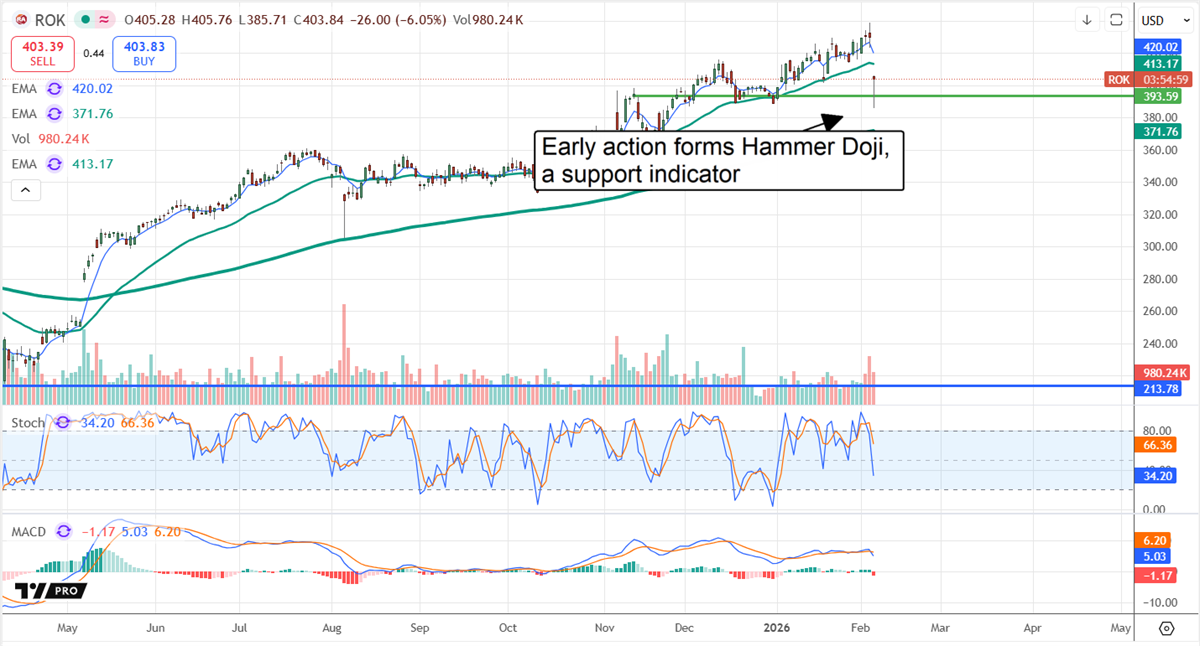
ROK stock chart illustrating early action that forms a Hammer Dojo

Recent News